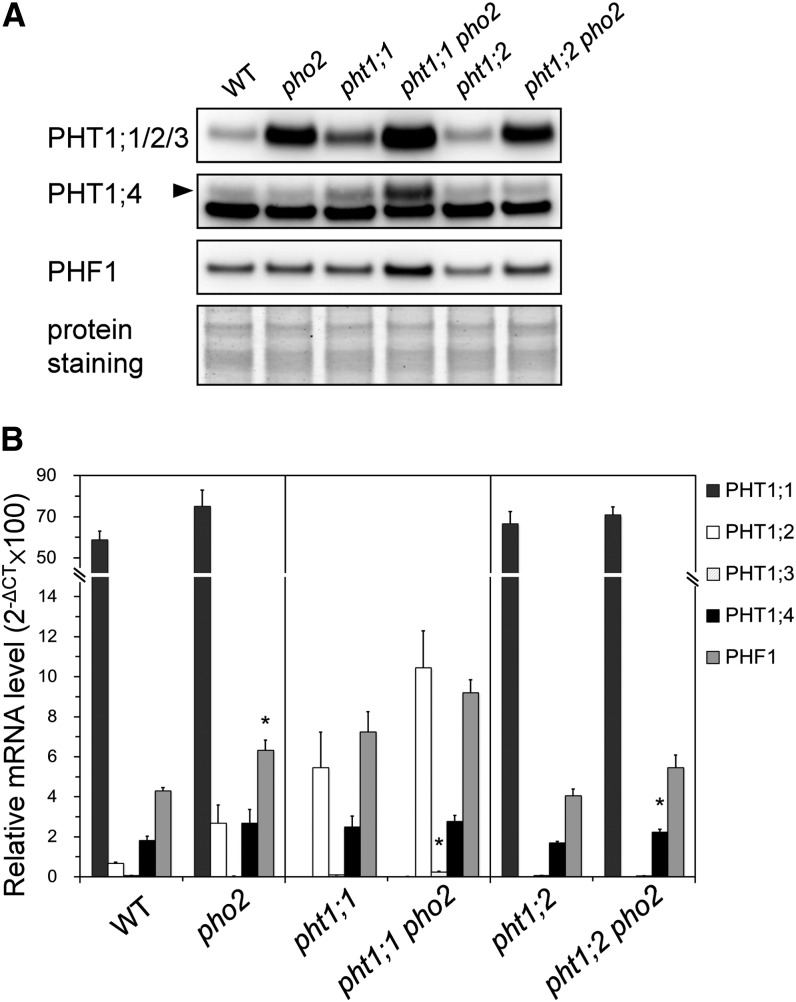
Figure 5.
PHO2 Negatively Regulates the Protein Level of PHF1 and PHT1s.
(A) Immunoblot analysis of PHT1;1/2/3, PHT1;4, and PHF1 proteins in the roots of 18-d-old wild-type (WT) and pho2, pht1;1, pht1;1 pho2, pht1;2, and pht1;2 pho2 plants grown under Pi-sufficient conditions. The bottom panel shows the protein staining on the blot.
(B) Quantitative RT-PCR analysis of PHT1;1, PHT1;2, PHT1;3, PHT1;4, and PHF1 mRNA in the roots of the wild type and mutants. Error bars represent se (n = 3). Data significantly different from the corresponding controls are marked by an asterisk (pho2 versus the wild type, pht1;1 pho2 versus pht1;1, or pht1;2 pho2 versus pht1;2, 0.01 < *P < 0.05, Student’s t test). CT, cycle threshold.

