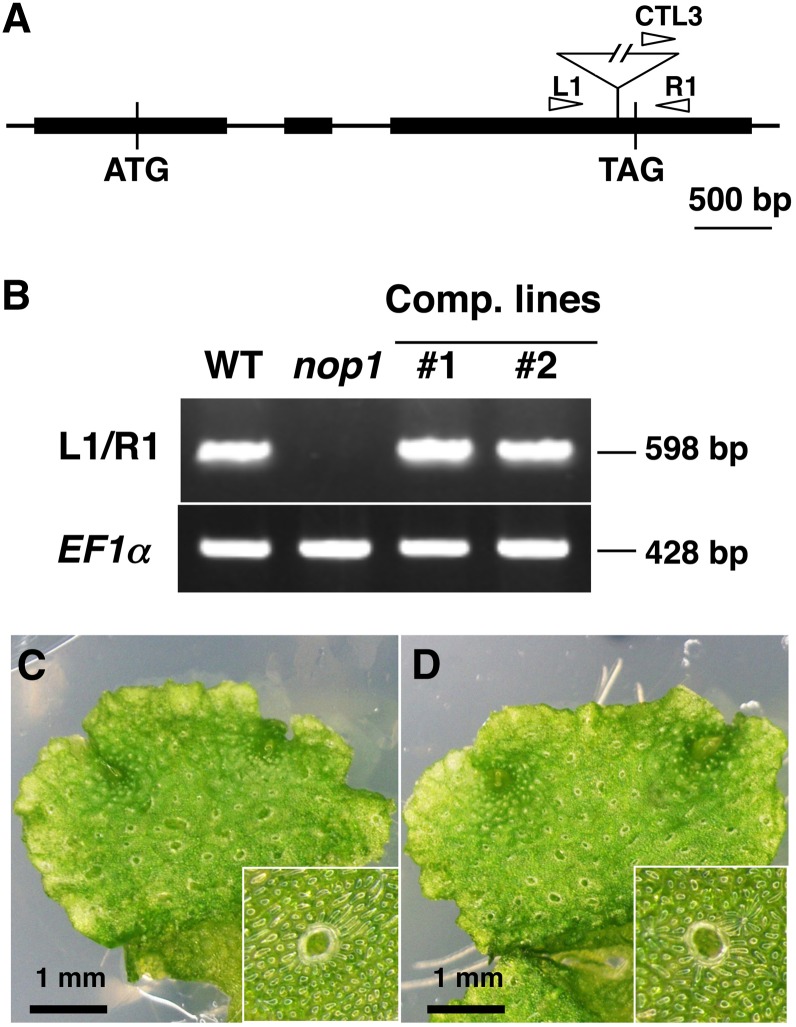
Figure 4.
Identification of the Causal Gene for nop1.
(A) Gene organization of NOP1. Arrow heads represent the positions of primers used for genotyping of wild-type and transgenic lines. Solid rectangles indicate exons, and an open triangle indicates the position of the T-DNA insertion in nop1.
(B) RT-PCR analysis of total RNA from the wild type (WT), nop1, and complemented lines, with the primer sets indicated on the left. The positions of each primer in the NOP1 genomic locus are indicated in (A).
(C) and (D) Phenotype of complemented lines #1 (C) and #2 (D) and magnified images (insets).

