Figure 7.
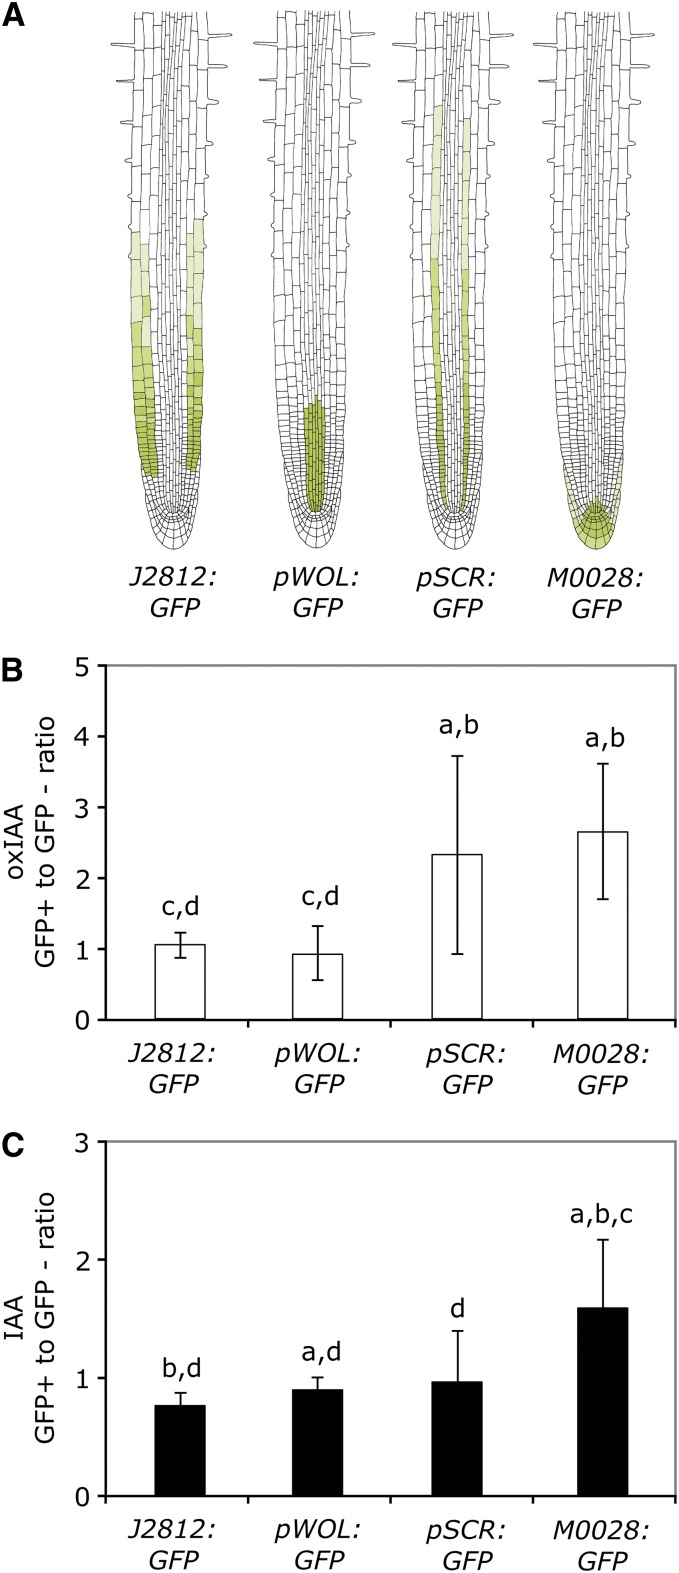
OxIAA and IAA Levels in Four Different Cell Types Isolated from the Arabidopsis Root.
Roots from 8-DAG Arabidopsis seedlings expressing GFP in specific cell types were protoplasted and sorted using FACS, and the concentrations of IAA and oxIAA were quantified in the collected GFP+ and GFP− cell populations using LC-MS/MS.
(A) GFP expression patterns of the Arabidopsis lines J2812:GFP, pWOL:GFP, pSCR:GFP, and M0028:GFP.
(B) and (C) For each of the four GFP lines, the ratio between the oxIAA (B) and IAA (C) concentrations in the GFP+ and GFP− cell populations was calculated. Error bars indicate sd (n = 7–11). Letters above the bars are as follows: a, significantly different from J2812:GFP; b, significantly different from pWOL:GFP; c, significantly different from pSCR:GFP; d, significantly different from M0028:GFP (Student’s t test, P < 0.05).
[See online article for color version of this figure.]

