Figure 7.
Resistance to Necrotrophic Fungal Pathogens Requires RLP30, BAK1, and SOBIR1.
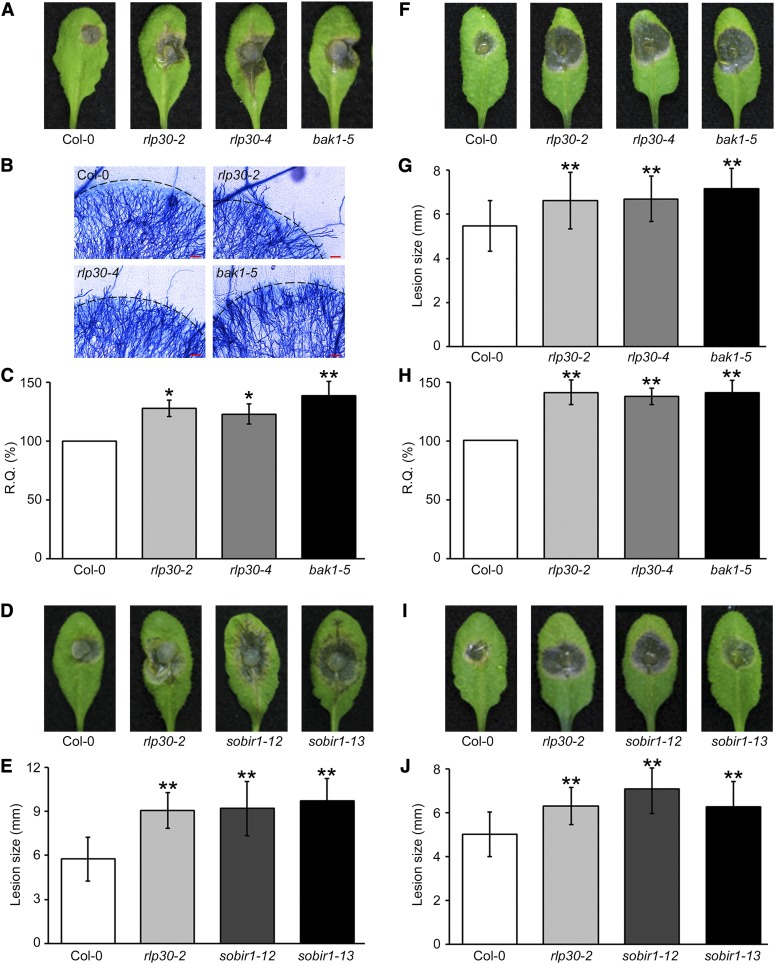
Infections with S. sclerotiorum ([A] to [E]) or B. cinerea ([F] to [J]).
(A) Symptom development on Col-0 plants or rlp30-2, rlp30-4, and bak1-5 mutant plants 2 d after inoculation with S. sclerotiorum strain 1980.
(B) Trypan blue staining of fungal hyphae 2 d after inoculation. A ring of blue-stained dead plant cells is indicated by a black line. Red bars = 100 µm.
(C) Fungal biomass determined by qRT-PCR (relative quantity [R.Q.]) 2 d after S. sclerotiorum infection in wild-type Col-0 plants or the indicated mutant line. S. sclerotiorum ITS genomic DNA levels are shown relative to the level of the Arabidopsis chloroplast-encoded reference gene ribulose-1,5-bis-phosphate carboxylase/oxygenase large subunit. Col-0 wild type is set to 100% relative quantity. Shown are means ± sd (n = 4). One-way analysis of variance (ANOVA) [F(3,12) = 7.902, P = 0.0036] followed by Dunnett’s multiple comparison test indicate a significant difference (*P < 0.05 and **P < 0.01) between the data sets from mutant plants compared with Col-0.
(D) and (E) For (D), symptom development on Col-0 plants or rlp30-2, sobir1-12, and sobir1-13 mutant plants was measured as described in (A), and lesion sizes determined 2 d after inoculation (E). Results represent means ± sd (n ≥ 16). One-way ANOVA [F(3,71) = 28.34, P < 0.0001] and Dunnett’s test (**P < 0.01) were performed.
(F) and (G) Col-0 plants or rlp30-2, rlp30-4, and bak1-5 mutants were drop-inoculated with 5 μL of a 2 × 10⁶ spores mL−1 solution of B. cinerea and symptom development (F) or lesion sizes (G) were determined 3 d after inoculation. Results represent means ± sd (n = 20). One-way ANOVA [F(3,79) = 8.243, P < 0.0001] and Dunnett’s test (**P < 0.01) were performed.
(H) Fungal biomass at 3 d after inoculation was determined using B. cinerea Actin genomic DNA levels relative to Arabidopsis ribulose-1,5-bis-phosphate carboxylase/oxygenase levels as described in (C). One-way ANOVA [F(3,12) = 8.042, P = 0.0033] and Dunnett’s test (**P < 0.01) were performed.
(I) and (J) Symptom development (I) and lesion sizes (J) on Col-0 plants or rlp30-2, sobir1-12, and sobir1-13 mutants were measured as described in (F) and (G). Results represent means ± sd (n = 20). One-way ANOVA [F(3,80) = 14.22, P < 0.0001] and Dunnett’s test (**P < 0.01) were performed.

