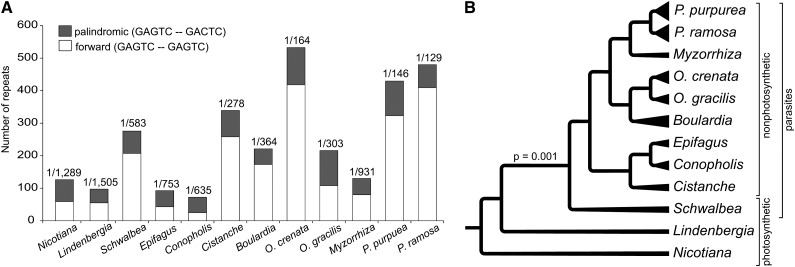
Figure 2.
Repeat DNA in Plastomes of Orobanchaceae.
(A) Proportions of different repeat types in plastomes of 11 Orobanchaceae species and tobacco. Numbers above individual repeat columns indicate the repeat density, where, for example, 1/500 means that one repeat occurs every 500 bp. The direction is given for each repeat type.
(B) Evolution of repeats in Orobanchaceae. The strong evolutionary trend of increasing numbers of repetitive DNA in plastid genomes after the transition to heterotrophy is shown by the P value from an LRT evaluating constant-variance random walk versus directional random walk models to explain repeat variation. The number of repeats is illustrated by differently sized triangles at the tip of each terminal branch. Brackets indicate different lifestyles.

