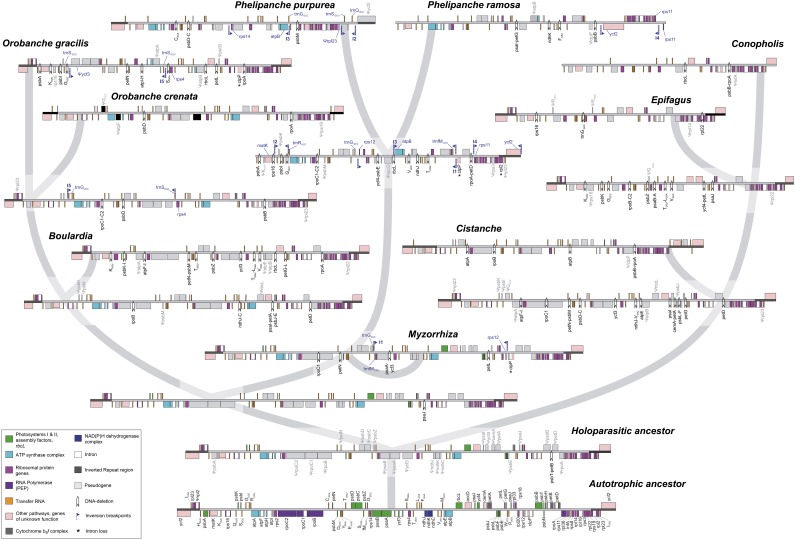
Figure 4.
Evolution of Plastomes Based on Likelihood Reconstructions of Ancestral Gene Contents and the Rearrangement History.
The reconstructed plastid LSCs plus their adjacent regions are shown at all nodes of the Orobanchaceae phylogeny (thick gray lines), except for the ancestor of Phelipanche and Myzorrhiza because it differs from M. californica only by having not yet lost rpoC1, petN, psaA, petL, and ndhH. Pseudogenes are indicated by gray gene boxes and gene names with a Ψ-prefix, whereas deletions are indicated by black arrowheads and the corresponding gene name(s). Gene labels with an asterisk indicate intron losses. Blue pennons indicate the breakpoints of an inversion (I1 to I5); the range and orientation of these inversions are denoted in both the ancestral and the derived plastid genome, and the genes flanking inversion breakpoints are labeled accordingly. For simplicity, SSC and IR are not shown here.

