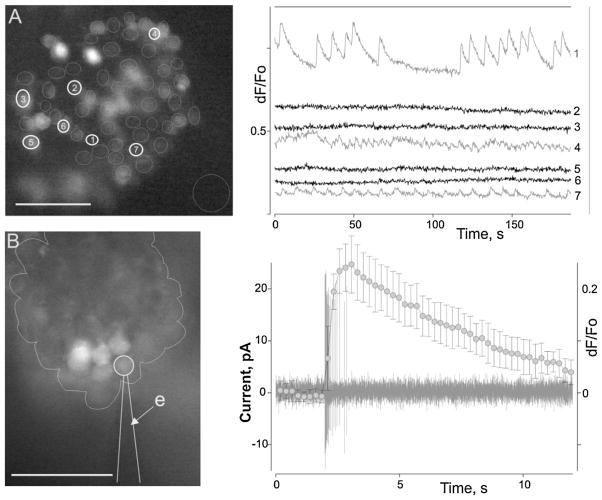
Fig. 1.
Activity of lobster ORNs monitored in situ using calcium signal recording (A) or both calcium signal and electrophysiological recording (B). (A) ORN population activity recorded from a single neuronal cluster (A, left). Cells were loaded with a calcium sensitive dye (Fluo4-AM). Circles mark individual ORN somata (analysis regions). Seven raw calcium signal traces are shown (A, right panel). Note that some cells exhibit profound spontaneous calcium oscillations of differing patterns and frequencies. (B) ORN calcium oscillation is a typical characteristic of bursting ORNs (bORNs). Simultaneous extracellular spike and calcium signal recording from an oscillating ORN (B, left) demonstrates the relationship between calcium oscillatory events and burst generation. (B) Right – a typical burst of the ORN (black trace) overlapping the average calcium event (grey line and symbols, bars – SD, n = 15). Bursting parameters for the cell (mean inter-burst interval (IBI) ± SD, s; number of spikes in burst; burst duration, s; n): 16.8 ± 0.9, 17.7 ± 0.7, 0.63 ± 0.05, 30. (B) Left – the line outlines an individual ORN cluster. Micrographs in (A) and (B) were taken under different magnifications. e indicates the recording electrode. Scale bar = 50 μm.

