
Figure 1.
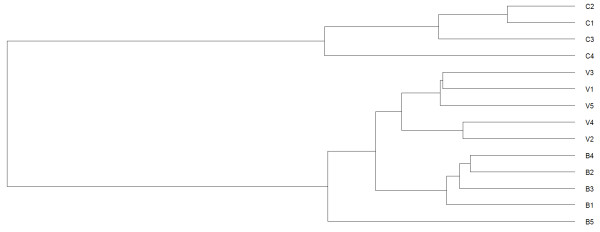
Clustering analysis of gene expression profiles of monocytes. The label V represents for viremic patients, B for BDLs, and C for controls.
Official websites use .gov
A
.gov website belongs to an official
government organization in the United States.
Secure .gov websites use HTTPS
A lock (
) or https:// means you've safely
connected to the .gov website. Share sensitive
information only on official, secure websites.
Clustering analysis of gene expression profiles of monocytes. The label V represents for viremic patients, B for BDLs, and C for controls.