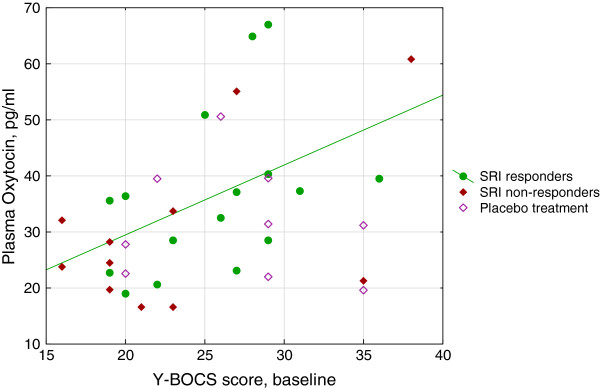
Figure 1.

Correlation between baseline severity of OCD and baseline plasma oxytocin according to SRI response. Severity of OCD is indicated by total score on the Y-BOCS. Due to non-normal distribution of oxytocin, non-parametric analyses were performed; in the figure, however, a regression line for the SRI responders derived from a Pearson’s correlation (y = 4,5445 + 1,2468*x; r = 0,42; p = 0,10) is included. Spearman’s correlation statistics for the various groups: The entire sample: rho = 0.35, n = 36, p = 0.037. SRI responders: rho = 0.58, n = 16, p = 0.019. SRI non-responders: rho = 0.24, n = 11, p = 0.47. Placebo treated: rho = -0.18, n = 9, p = 0.64. OCD = obsessive-compulsive disorder; SRI = serotonin reuptake inhibitor; Y-BOCS = Yale-Brown Obsessive Compulsive Scale.
