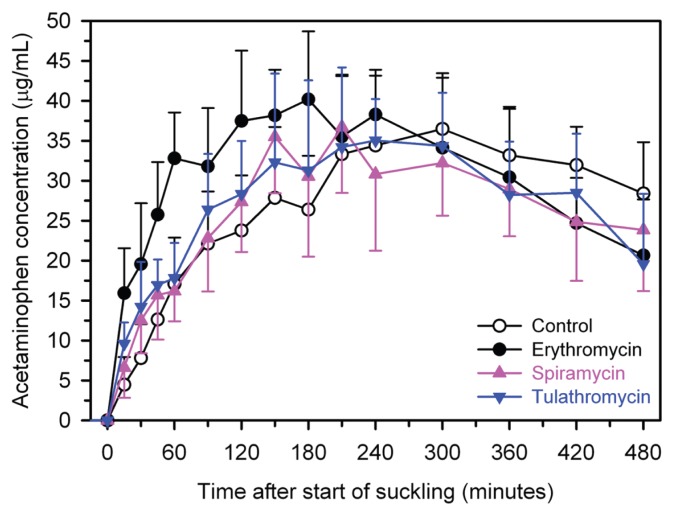
Figure 1.
Mean ± standard deviation (SD) plasma concentration of acetaminophen in 6 calves after treatment with spiramycin (75 000 IU/kg BW, IM, pink triangles), tulathromycin (2.5 mg/kg BW, SC, blue triangles), a negative control (2.0 mL of 0.9% NaCl solution IM, open circles), or a positive control (erythromycin, 8.8 mg/kg BW, IM, black circles) using a crossover design. Calves were allowed to suckle 2 L of fresh cow’s milk containing acetaminophen (50 mg/kg BW) 30 min after treatments were administered.

