Figure 1.

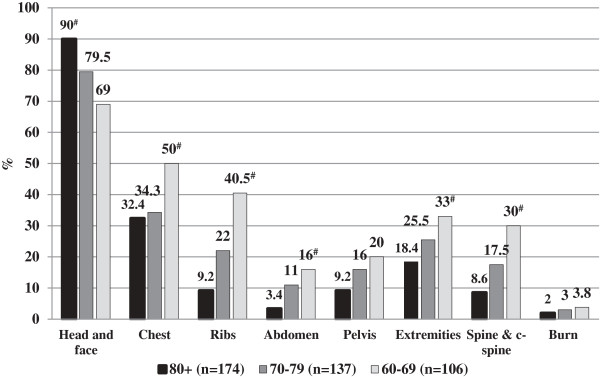
Injury patterns according to the different age groups (data shown as percentage points). # p < 0.05 Chi squared test for trends.

Injury patterns according to the different age groups (data shown as percentage points). # p < 0.05 Chi squared test for trends.