
Figure 1.
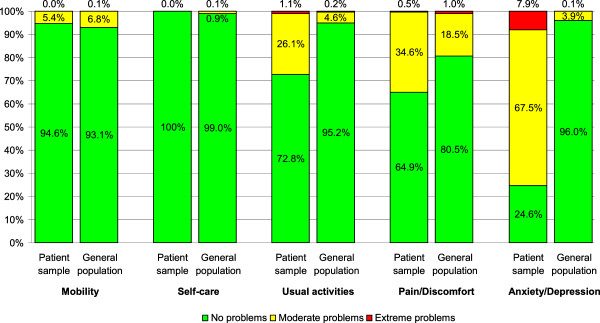
Comparison of EQ-5D dimensions between patient sample (n = 445) and general population (n = 3137). Data of the general population from [28]. Respondents of the general population were adjusted to age and gender. There were one missing value in “usual activities” (n = 444) and two missing values in “anxiety/depression” (n = 443) in patients with social phobia.