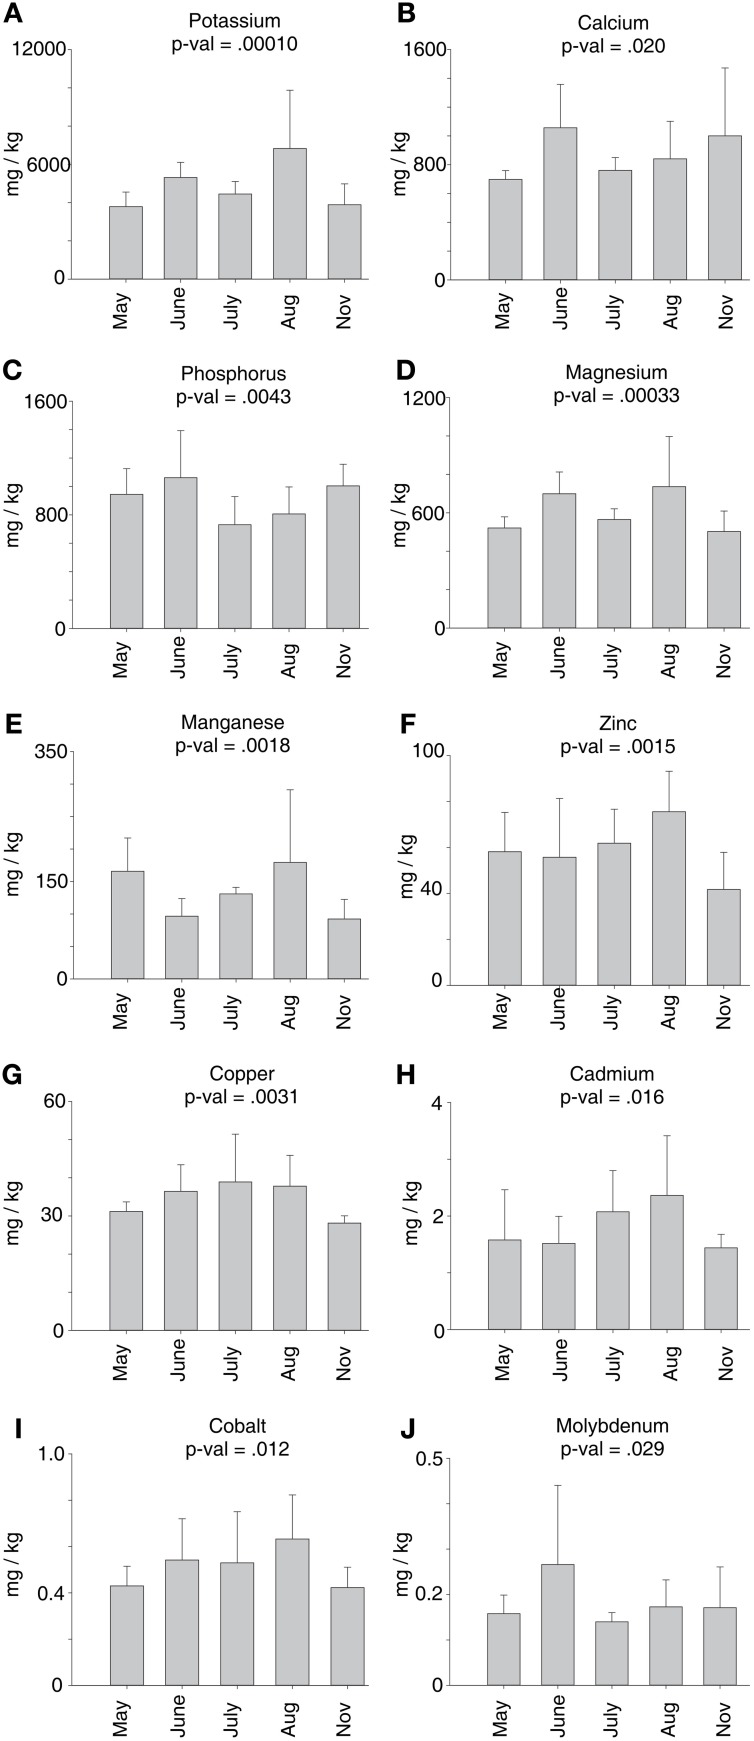
Figure 8.
Mineral concentrations in crowns and rhizomes of field grown cv Summer plants across harvest dates. Each panel shows the change in mineral concentration for a specific mineral. Analysis for each time point consisted of two technical replicates from each of three biological replicates (n = 6). Average abundances with standard deviation error bars are shown in this figure. P-values were calculated for each mineral using Single-Factor ANOVA. (A) Potassium; (B) Calcium; (C) Phosphorus; (D) Magnesium; (E) Manganese; (F) Zinc; (G) Copper; (H) Cadmium; (I) Cobalt; (J) Molybdenum.

