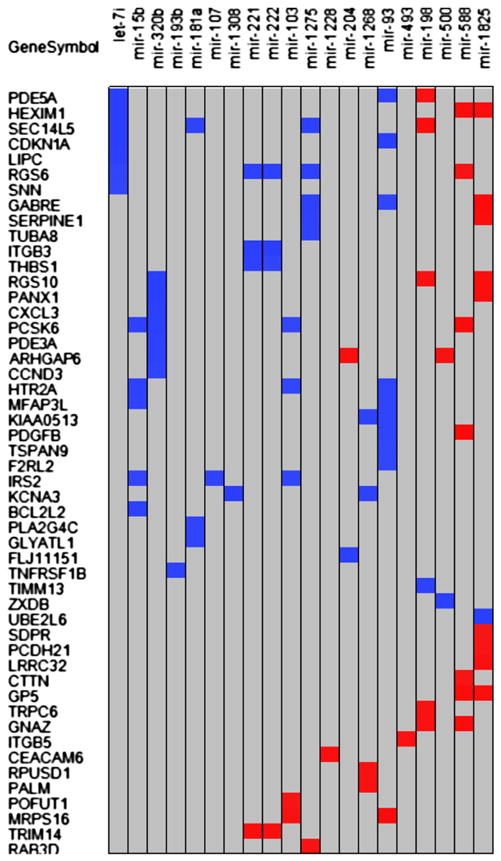
Figure 4.

Correlation of selected differentially expressed miRNAs with potential differentially expressed targets. Twenty miRNAs had significant correlation with at least 1 of 50 being differentially expressed. Potential target mRNAs are shown. Blue indicates a negative, and red indicates a positive correlation. There were 87 significant correlations at p ≤ 0.05. All correlation coefficients have an absolute value of 0.95 or higher.
