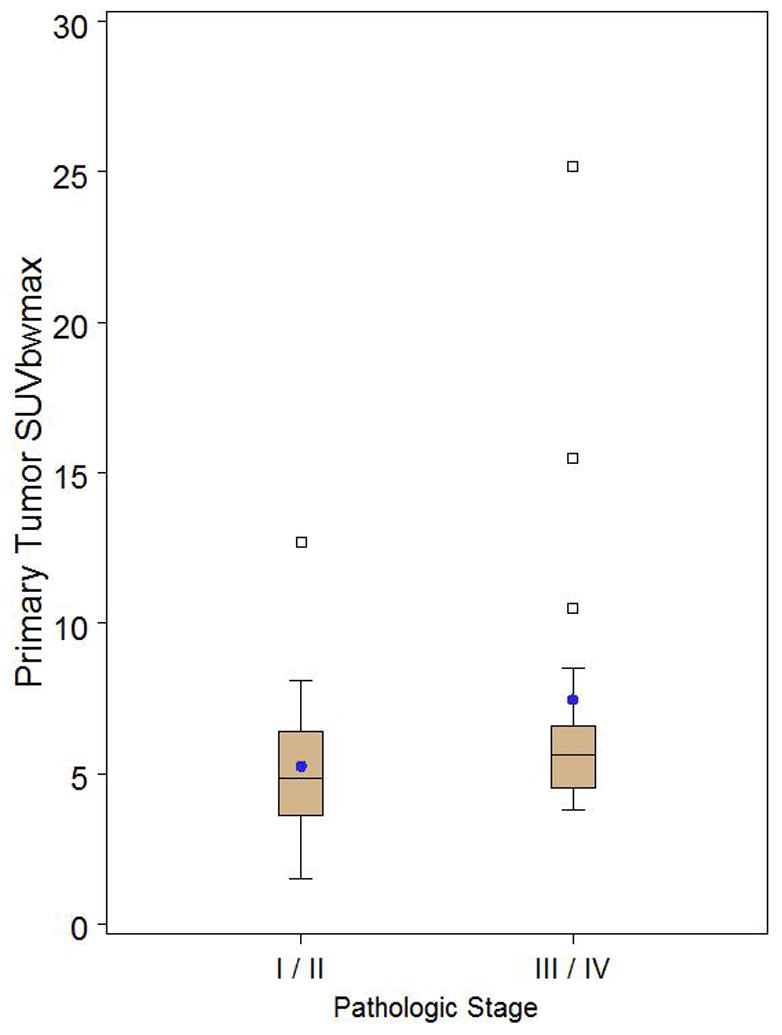
FIGURE 6.

Box and whisker plot of thymoma only patients stratified by pathologic stage I/II (n=20) versus III/IV (n=17) demonstrating no significant difference in primary tumor SUVmax (p=0.1351). Observations above the upper fence, defined as 1.5 IQR above the 75th percentile, are displayed as squares. The middle black line in box represents the median. The blue dot represents the mean.
