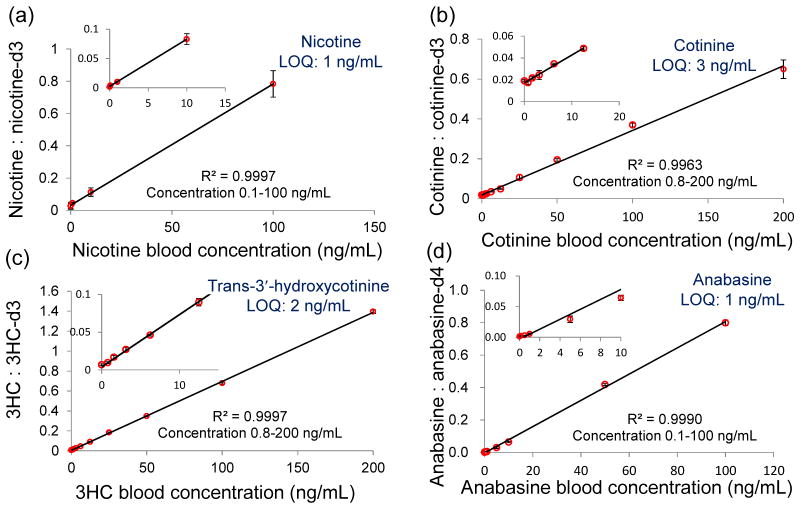
Figure 2.
Calibration curves of nicotine (a), cotinine (b), 3HC (c) and anabasine (d) in dried blood spots. The blood samples were spiked with each alkaloid and its isotopically labeled internal standard (100 ng/mL). Inset plot shows low concentration range. The bars represent the standard deviation of analysis for three replicates at different concentrations.

