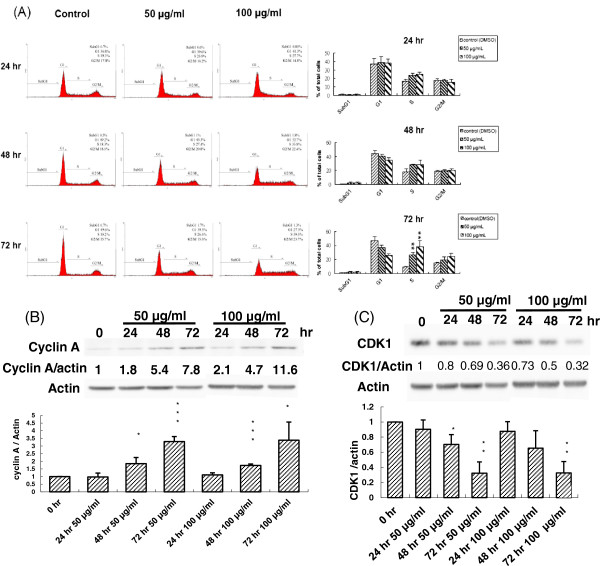
Figure 3.
Induction of human T24 cell cycle arrest by PEE. Human T24 cells were incubated with 50 or 100 μg/ml of PEE for the indicated time periods and cell cycle analyses were determined by flow cytometry as described in section 2. The representative diagram was shown in (A), and the mean ± S.D. of three independent experiments was indicated in the right panel. Human T24 cells were treated with 50 or 100 μg/ml of PEE for different time durations and cyclin A as well as CDK1 in cell lysates were detected by western blotting with the antibodies against cyclin A (B) and CDK1 (C) respectively as described in section 2. The blot in each diagram was the representative result of three independent experiments and the densitometer-intensity data (mean ± S.D.) were shown under each blot. *, ** and *** represented P < 0.05, P < 0.01 and P < 0.001 respectively as compared to untreated cell using Student’s t-test.

