
Figure 3.
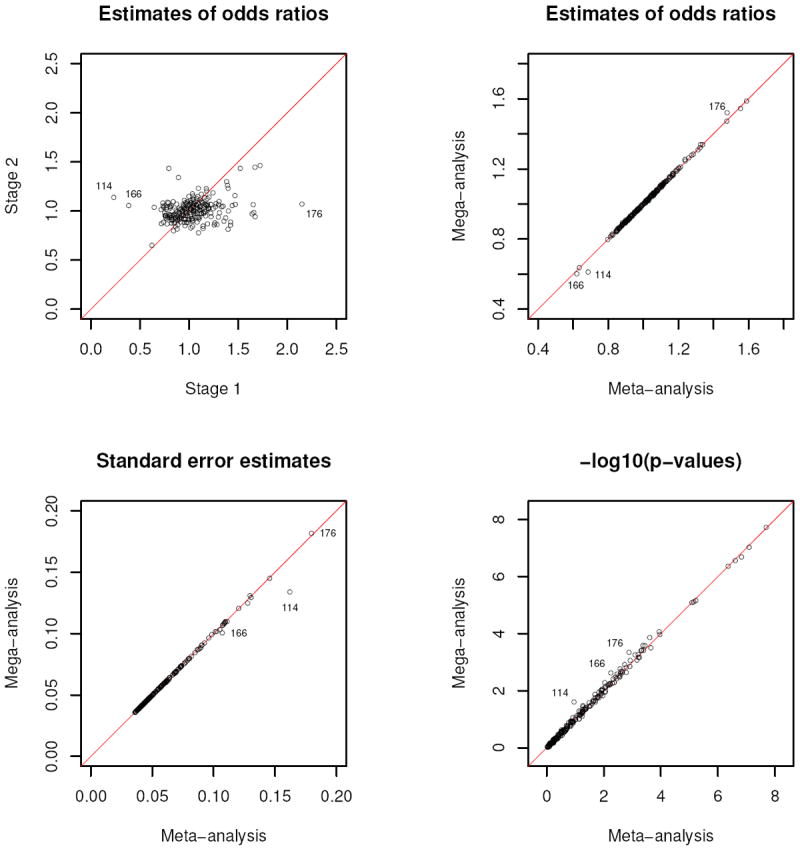
Analysis of stages 1 and 2 data from the FUSION study adjusted for age and sex. The top left panel compares the individual estimates of odds ratios between stages 1 and 2; the top right panel compares the combined estimates of odds ratios between meta-analysis and mega-analysis; the bottom left panel compares the standard error estimates between the two methods; and the bottom right panel compares the − log10(p-values) between the two methods. Mega-analysis assumes age and sex effects to be the same between stages 1 and 2 whereas meta-analysis does not. In each panel, the red line indicates where the values on the two axes are equal.