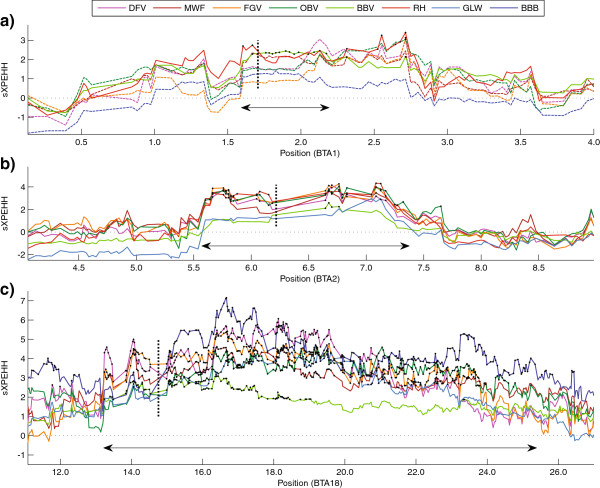
Figure 2.
Selection signatures around loci responsible for three distinct phenotypes used for confirmation. Plot of sXPEHH values (y-axis) around the loci (x-axis in Mb) responsible for a) polledness in GLW b) double muscling in BBB and c) red coat colour in RH. A vertical dashed line marks the position of the target regions. Black asterisks mark significant SNPs. XP-EHH comparisons with control breeds that did not reach significance within a signature are in dashed lines. A double arrow marks the extensions of the detected signatures.

