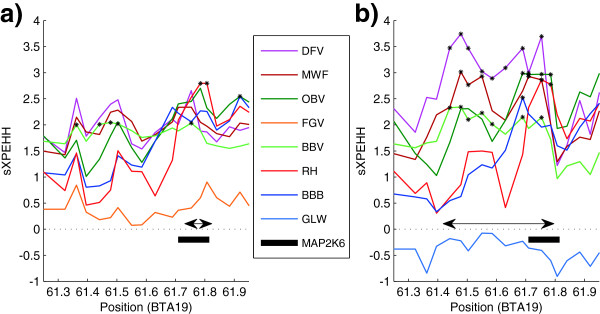
Figure 3.

Selection signature around MAP2K6 in GLW and FGV. Plot of the sXPEHH values (y-axis) of two detected selection signatures around MAP2K6 (x-axis in Mb) in a) GLW and b) FGV. Asterisks mark significant SNPs. A double arrow marks the extensions of the detected signatures.
