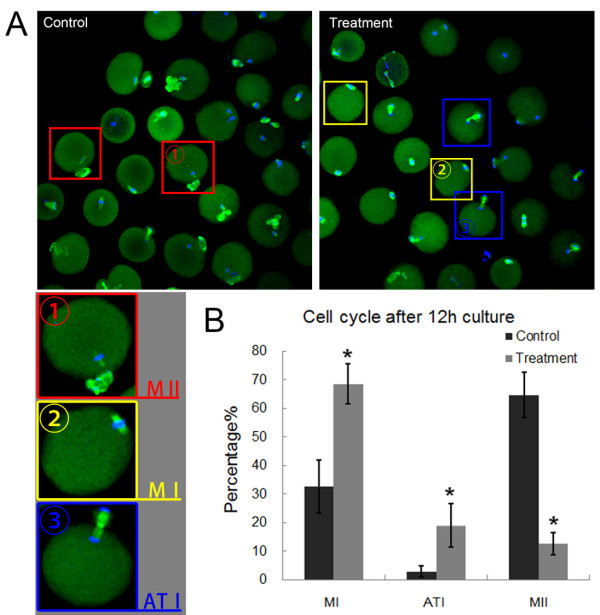
Figure 3.
Effects of MKlp2 disruption on cell cycle distributions during oocyte maturation. (A) Most control oocytes reached the MII stage, whereas substantial proportions of paprotrain-treated oocytes remained in the MI and ATI stage. Red boxes in controls indicate oocytes that reached the MII stage. Yellow boxes in treated oocytes indicate that they stayed at the MI stage and blue boxes indicate oocytes arrested at the TI stage. Green, α-tubulin; blue, chromatin. (B) Stages after 12 h in culture for treated oocytes. Most oocytes failed to reach the MII stage and were arrested at the MI and ATI stages. *significantly different (p < 0.05).

