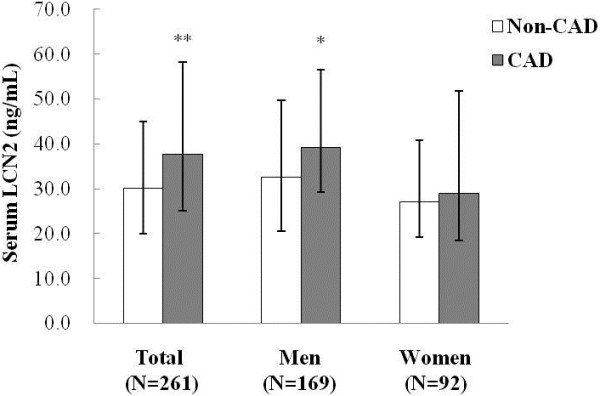
Figure 1.

Comparison of serum LCN2 levels between subjects with and without CAD. White bars, non-CAD subgroup; grey bars, CAD subgroup. ** p < 0.01, CAD vs. non-CAD in total; * p < 0.05, CAD vs. non-CAD in men. Data are presented as median (inter-quartile range).
