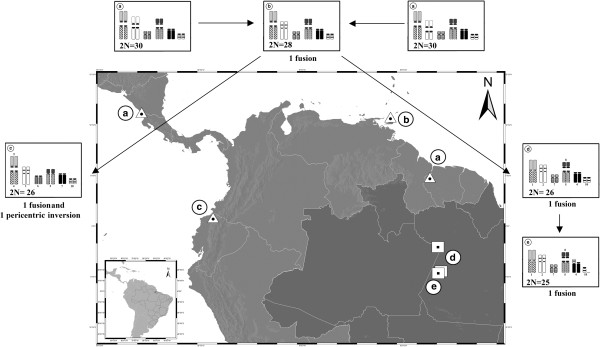
Figure 5.

Map of compared samples of Micronycteris hirsuta. Triangles indicate the sites from which previous cytogenetic descriptions were performed. Squares represent the cytogenetic samples studied herein (see Table 1 for locality details). Idiograms plotted beside each collection site represent the unique or shared chromosomes among specimens. Diploid number (2n) of specimen and the rearrangements that differentiate the different cytotypes are indicated below each idiogram. Idiograms of MHI from a) MHI from Honduras, Nicaragua and Suriname; b) Trinidad and Tobago; c) Ecuador; d) and e) Present work. For specimens of Ecuador with 2n = 26 the numeration of chromosome arms is according Fonseca et al.[12]. For details see text and Table 1.
