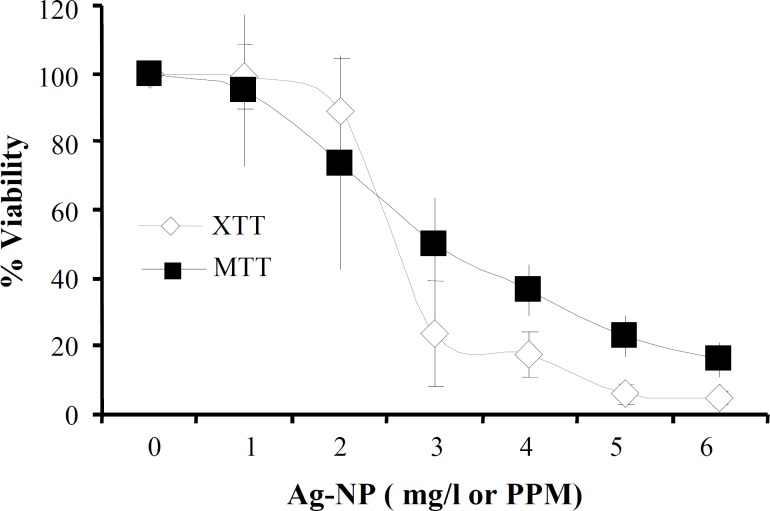
Fig. 1.
IC50 determination. Cell viability was measured by XTT and MTT assays on HepG2 cells after a 24 h exposure to increasing doses of AgNP. The data are expressed as mean standard deviation of two independent experiments. An OD value of control cells was taken as 100% viability. The relative cell viability related to control was calculated by [OD]test/[OD]control 100. Using the dose-response curves, IC50 was calculated to be 2.75-3.0mg/l (ppm).

