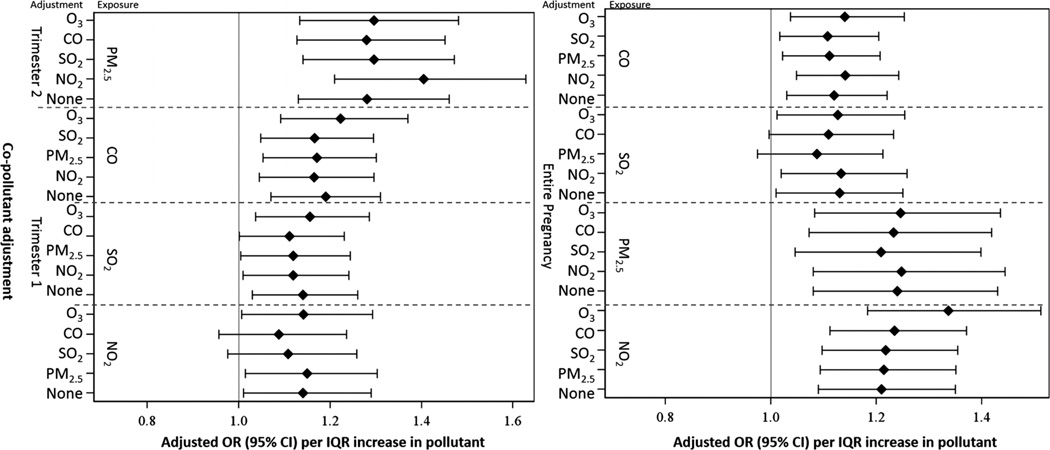
Figure 2.
Adjusted OR for risk of hypertensive disorders of pregnancy per IQR increase in gestational exposure to pollutant, for single and two-pollutant models among women who gave birth from 2004 to 2005 in Jacksonville, Florida, USA. The point reflects the central estimate; the horizontal line represents the 95% CI.

