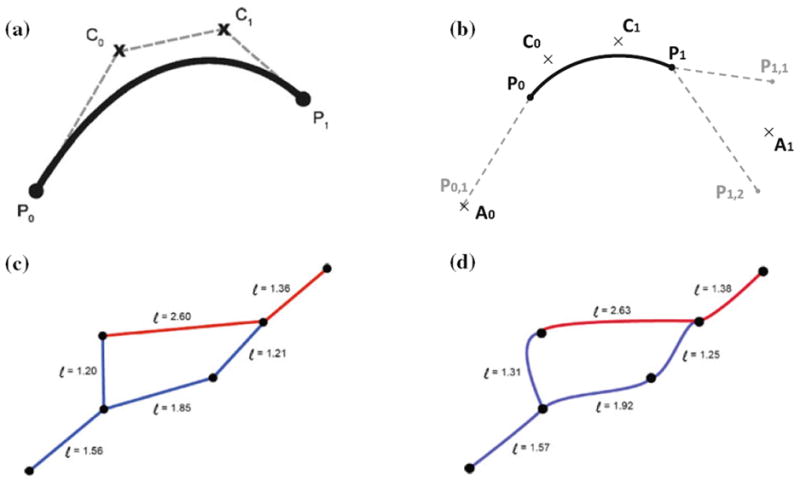
FIGURE 10.

Bezier Curve adjustment of capillary tortuosity. (a) Depiction of a Bezier curve between endpoints, , and control points, , . (b) Automatic generation of control points based on segments connected to the current Bezier segment. (c) Straight line segments. (d) Tortuous capillary segment with Bezier curve parameter, α = 0.25.
