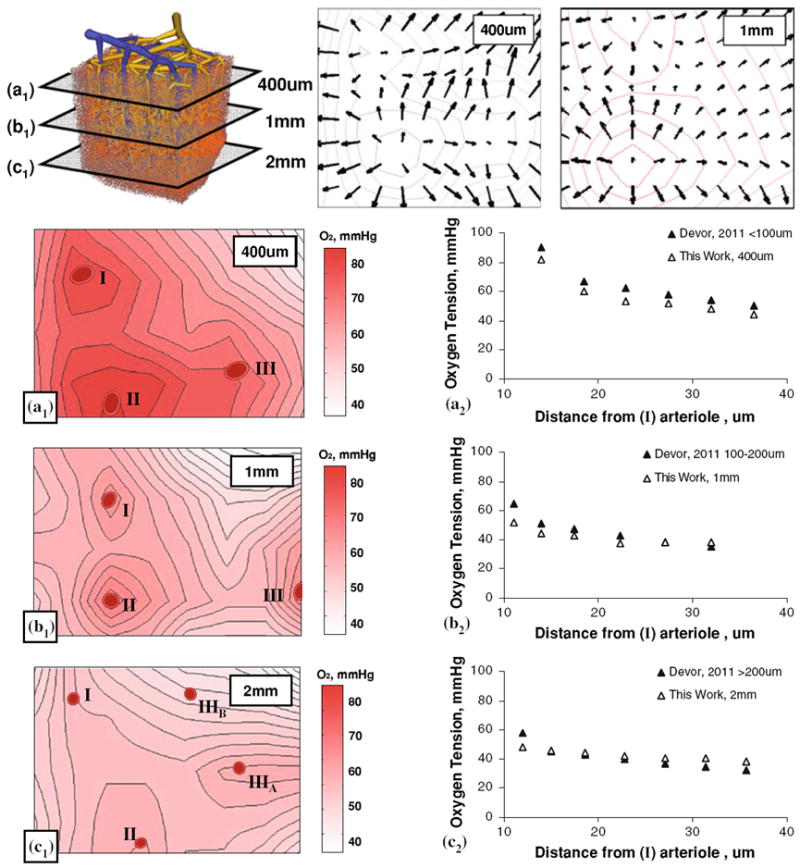
FIGURE 7.

Detailed study of hemodynamics of a typical vascular territory of a single draining vein with its associated arterioles and capillaries. (a) Blood pressure distribution. (b) Blood flow velocity. (c) Blood oxygen tension. (d) Volumetric blood flow rate. Analysis of twelve distinct paths a single red blood cell may take when traveling from a feeding descending arteriole to a nearby draining venule. Panels 1–3 each depict four typical sample paths chosen randomly, colored blue, green, yellow, and red. In total there are >236,000 number of paths for a single territory.
