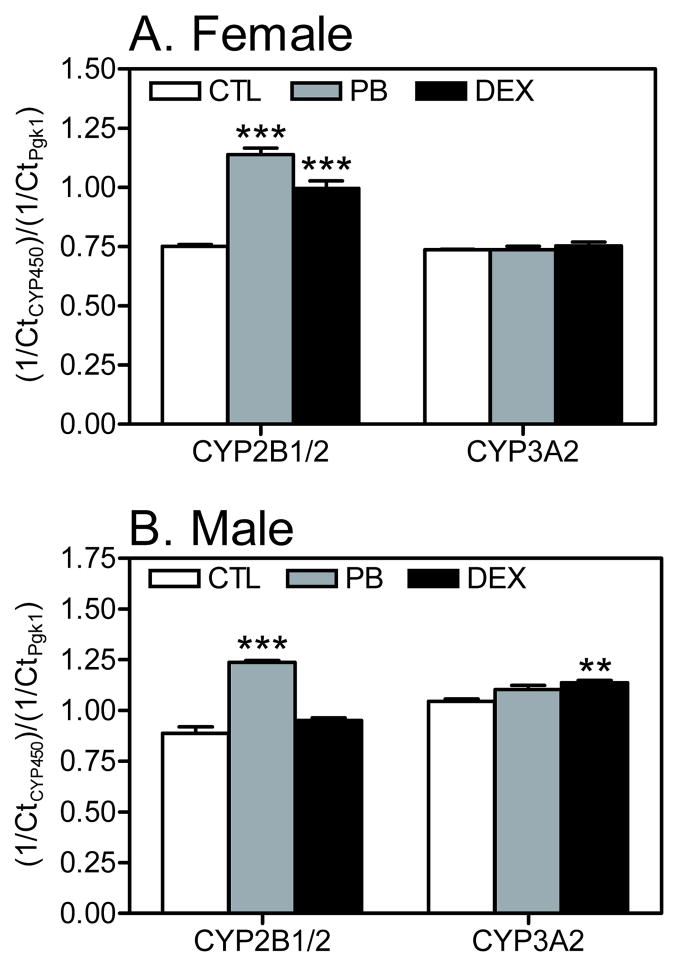
Figure 2.
Effects of PB and DEX treatment on hepatic cytochrome P450 transcript levels in rat liver slice cultures prepared from (A) female and (B) male rats. Total RNA was isolated from liver slices obtained from adult female and male rats (CTL or treated with PB or DEX), and reverse transcribed to cDNA. Transcript levels of specific cytochrome P450 isoforms was determined by qPCR. The relative amount of transcript is expressed as the Ct value for a specific CYP normalized to the Ct value for the reference gene (Pgk1) in the same sample. Data are expressed as the mean ± S.E.M. (n=2–3 rats per treatment; see Table S1). **p < 0.01; ***p < 0.001 indicates statistically significant differences between treated and untreated rats as determined by two-way ANOVA (GraphPad Prism software).

