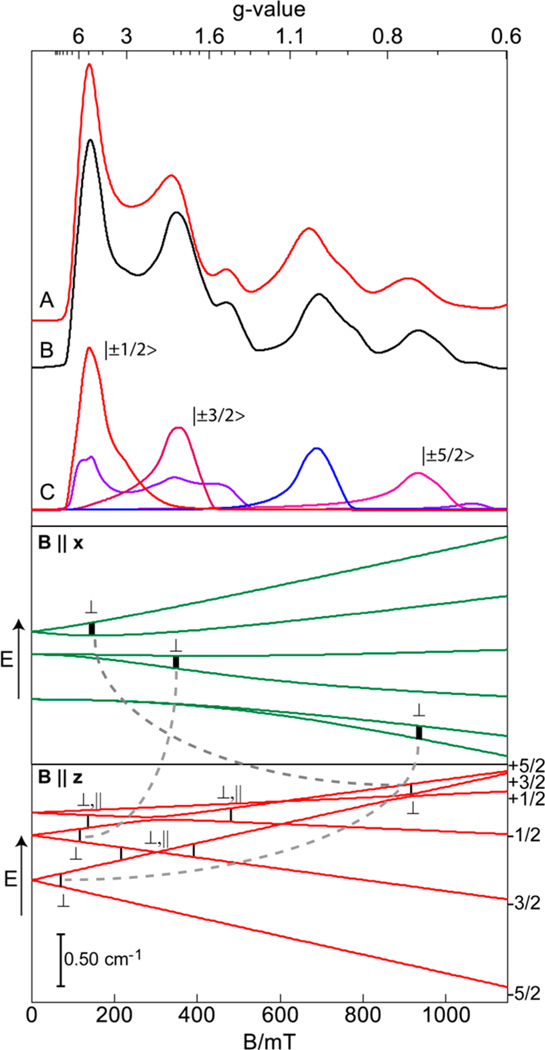
Figure 4.
Top panel: Absorption X-band EPR spectrum (A) and simulation (B) of the MnII–OH complex. The simulation parameters are in Table 1. (C) The contributions from approximate |±ms〉 transitions (reddish lines) and interdoublet transitions (bluish lines). Bottom two panels: The energies of the S = 5/2 spin manifold versus magnetic field B are shown for applied field along the x-axis (green) and z-axis (red) of the D-tensor. The vertical bars correspond to 9.6 GHz and indicate the important transitions for microwaves oscillating B1 ⊥ B and B1 ‖ B.

