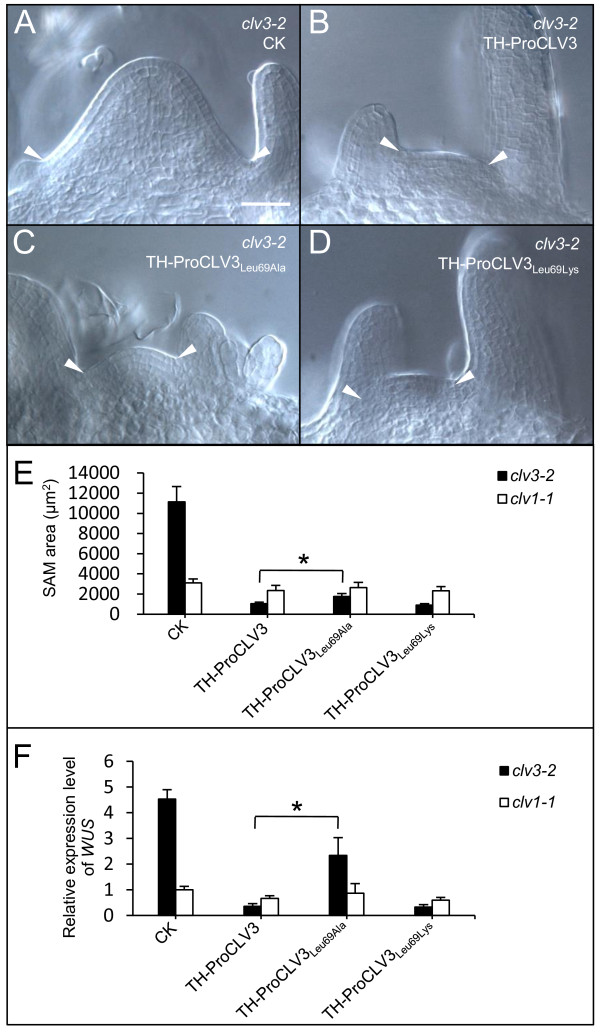
Figure 5.
In vitro SAM assays using TH-ProCLV3Leu69Ala or TH-ProCLV3Leu69Lys. (A-D) SAMs of clv3-2 after treatment with 1 μM TH-ProCLV3 (B), TH-ProCLV3Leu69Ala(C) or TH-ProCLV3Leu69Lys(D), as compared to control samples without fusion proteins (A). The arrowheads indicate margins of the SAMs. The bar in A = 50 μm for A to D. (E) Areas of SAMs of 8-d-old clv3-2 and clv1-1 seedlings treated with or without fusion proteins (n = 8). Error bar = ± SD. (F) qRT-PCR analyses of WUS expression in 8-d-old clv3-2 and clv1-1 shoot apices treated with or without fusion protein. The average expression level of WUS in clv1-1 without the fusion protein was normalized to 1, and values for other samples represent as relative ratios. Error bar = ± SD of 3 independent biological repeats. The asterisks in E and F indicate significant differences (P < 0.01 by Student’s t-test) between TH-ProCLV3- and TH-ProCLV3Leu69Ala-treated clv3-2 seedlings.

