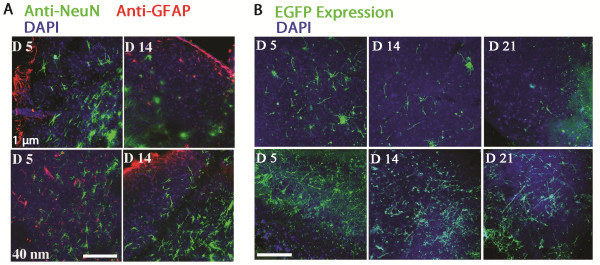
Figure 3.

Microscopy images of subpopulation labelling and exogene expression profiles. A) Confocal images of the 40 nm and 1 μm treated OTBS immunolabelled with anti-NeuN, anti-GFAP, and DAPI seen at 5 and 14 days post transfection. Healthier cell morphologies can be observed in the 40 nm compared to the 1 μm treated OTBS. Scale bar: 100 μm. B) Confocal images of EYFP expression patterns seen in 40 nm and 1 μm transfected OTBS. A higher number of EYFP positive cells, maintaining neuronal morphology, can be observed in the 40 nm compared to 1 μm treated OTBS and this expression pattern remains longer (21 days). Scale bar: 100 μm.
