
Fig. 3.
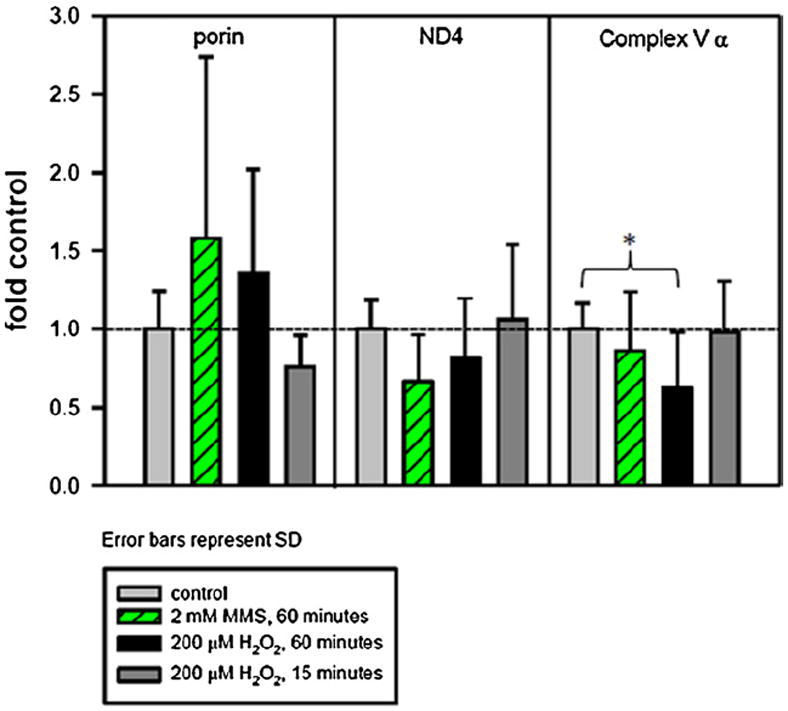
H2O2 and MMS affect mitochondrial protein levels differently. Cells were plated and the following day were treated for 15 or 60 min with 200 μM H2O2 or for 60 min with 2 mM MMS in serum-free media. After the treatment, the media was replaced with conditioned media and the cells were allowed to recover for 8 h. Cells at 8 h recovery were harvested and subjected to western blotting with anti-ND4, anti-complex V α subunit, anti-porin and anti-β-actin. Histogram of ND4 and complex V α subunit levels after H2O2 or MMS treatment, normalized to β-actin (Fig. 3). For H2O2, four individual experiments were performed, with 2–4 separate gels per experiment and 1–3 replicates per treatment type. For MMS, three individual experiments were performed, with 1–2 gels per experiment and 3–6 samples per treatment type. Light gray bar, control; green striped bar, 2 mM MMS for 60 min; black bar, 200 μM H2O2 for 60 min; dark gray bar, 200 μM H2O2 for 15 min. Error bars represent standard deviation. A one-way ANOVA was used to analyze these data, p < 0.05 (*). Complex V α levels in cells treated for 60 min with 200 μM H2O2 are significantly decreased compared to control. (For interpretation of the references to color in this figure legend, the reader is referred to the web version of the article.)