
Fig. 5.
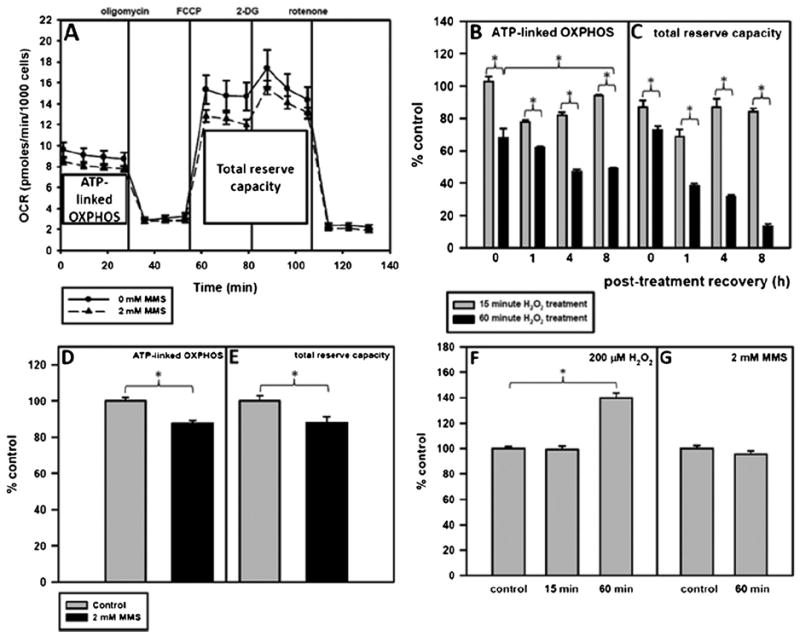
A 60-min H2O2 treatment and not a 60-min MMS treatment causes major mitochondrial dysfunction. Cells were plated and the following day were treated for 15 or 60 min with 200 μM H2O2 or for 60 min with 2 mM MMS in serum-free media. After the treatment, the media was replaced with conditioned media and the cells were allowed to recover. One hour before putting the cell plate into the Seahorse, unbuffered serum-free media was put on the cells and the cells were placed in a 0% CO2 incubator to rid the media of CO2. ATP-linked OXPHOS is represented by X̄1–4–X̄5–7 and total reserve capacity is represented by X̄8–13–X̄5–7. (A) Pharmacologic profile of mitochondrial OXPHOS 8 h after treatment with 2 mM MMS. Control-treated cells are represented by —●— and MMS-treated cells are represented by --▲--. Error bars represent the SEM of 2 separate Seahorse experiments with 6 replicates per run. (B) ATP-linked OXPHOS and (C) total reserve capacity of H2O2-treated cells at 0, 1, 4, and 8 h as compared to control-treated cells. (D) ATP-linked OXPHOS and (E) total reserve capacity of MMS-treated cells at 8 h as compared to control-treated cells. Basal glycolysis at 8 h after (F) H2O2 or (G) MMS treatment as compared to control-treated cells. ANOVA was used to analyze these data and a Tukey test for multiple comparisons was used to compare across groups, p < 0.05 (*). At all timepoints measured, the 60 min with 200 μM H2O2 treatment causes a significant reduction in mitochondrial function as compared to cells treated for 15 min with 200 μM H2O2.