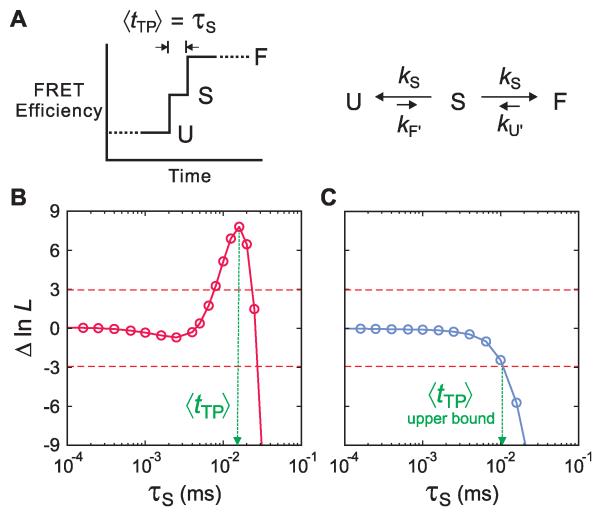
Fig. 4.
Determination of average transition-path times in a kinetic model. (A) Schematic of a FRET efficiency trajectory using a one-step model to describe the transition path from unfolded (U) to folded (F) states for a protein exhibiting two-state kinetics and thermodynamics. The average transition-path time, 〈tTP〉, is equal to the lifetime of a virtual intermediate state S (τS = (2kS)−1 ). (B and C) The difference of the log likelihood, ΔlnL = lnL(τS) − lnL(0), between the two-state model with a finite transition-path time and a two-state model with an instantaneous transition-path time is plotted as a function of τS for the WW domain in 3 M GdmCl/50% glycerol (B) and protein GB1 in 4 M urea (C). The horizontal dashed line at ΔlnL = +3 represents the 95% confidence limit for the significance of the peak in B and the intersection of the likelihood function with the horizontal dashed line at ΔlnL = −3 in C yields the 95% confidence limit for the upper bound of τS.

