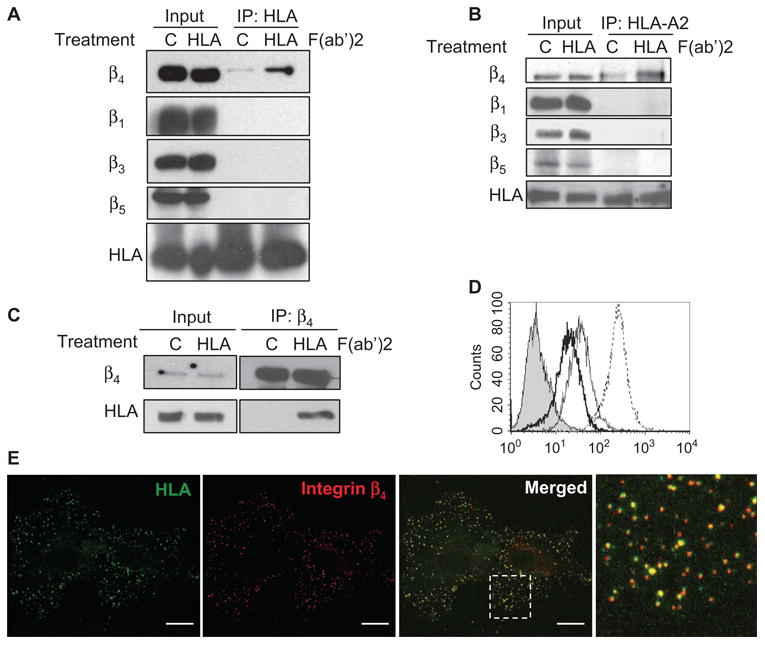
Fig. 1.

Ligation of HLA-I on endothelial cells triggers formation of a complex containing the integrin β4 subunit and HLA-I. (A) Endothelial cells (EC1) were stimulated with the F(ab′)2 fragments of W6/32 (an antibody against HLA-I) or with control IgG. Cell lysates were subjected to immunoprecipitation (IP) with W6/32 and analyzed by Western blotting with antibodies against the heavy chain of HLA-I (EMR8-5) and integrins β4, β1, β3, and β5, as indicated to the left of the blots. For each sample, 10% of the total cell lysate that was used in the immunoprecipitation was loaded as an input control. Data are representative of three independent experiments. (B) Endothelial cells (EC1) were stimulated as described in (A), lysates were subjected to immunoprecipitation with an antibody against HLA-A2, and samples were analyzed by Western blotting with antibodies against the HLA-I heavy chain (EMR8-5) and integrins β4 (205 kD), β1 (130 kD), β3 (105 kD), and β5 (88 kD). For each sample, 2.5% of the total cell lysate used in the immunoprecipitation reaction was loaded as an input control. Data are representative of two independent experiments. (C) Cells (EC3) were stimulated as described in (A), lysates were subjected to immunoprecipitation with an antibody against the integrin β4 subunit, and samples were analyzed by Western blotting with EMR8-5 or antibody against integrin β4. For each sample, 5% of the total cell lysate used in the immunoprecipitation reaction was loaded as an input control. Data are representative of four independent experiments. (D) Surface abundances of integrins were analyzed by flow cytometry. Unstained control cells are shown as a filled peak. The thick, thin, and dotted lines represent the surface expression of integrins β4, β3, and β1, respectively. Data are representative of four independent experiments. (E) Incubation of endothelial cells (EC1) with antibodies against the extracellular domains of HLA-I (green) and integrin β4 (red). The last panel is an enlarged field that is indicated by the white square in the merged image. Localization of both HLA-I and integrin β4 at the basal membrane was positively correlated as indicated by a correlation coefficient (r) of 0.63 and 0.72 for the merged image and boxed region, respectively. Scale bars, 20 μm. The data are representative of four independent experiments.
