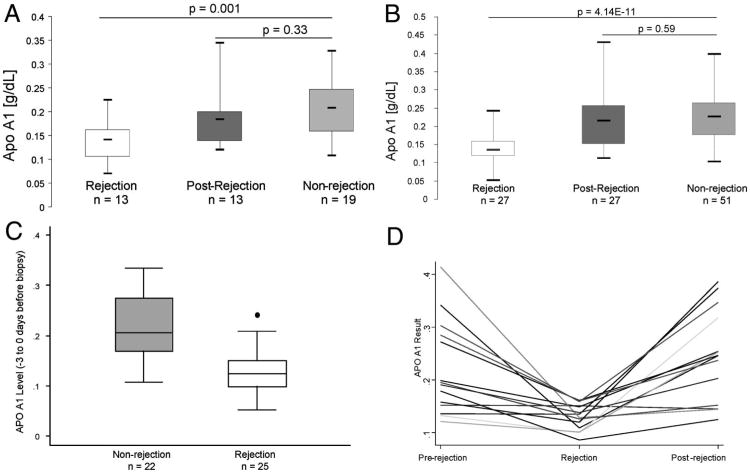
Figure 3.
Validation of apolipoprotein A1 (Apo A1) by enzyme-linked immunosorbent assay (ELISA) for association with acute cellular rejection. (A) Box plots of the ELISA results of plasma samples of a subset of the original cohort. (B) Box plots of the ELISA results of the plasma samples of the second independent cohort. (C) Box plots of Apo A1 levels in recipients that had a sample collected within – 3 to 0 days before the renal biopsy. Twenty-five rejection and 22 nonrejection samples were compared. The mean Apo A1 levels in nonrejection was 0.22 SD±0.06 and 0.13 SD±0.04 in rejection. The levels of Apo A1 were significantly lower at the time of rejection (P value <0.0001) compared with recipients with biopsy-proven nonrejection. (D) Line graph indicating the individual Apo A1 results for 14 patients who had plasma samples from all three time periods (prerejection, rejection, and postrejection). (E) ROC analysis comparing the rejection samples to the nonrejection samples from both the original cohort and the second cohort combined showing a cut point of 0.167 mg/dL and 76% sensitivity and 86% specificity.

