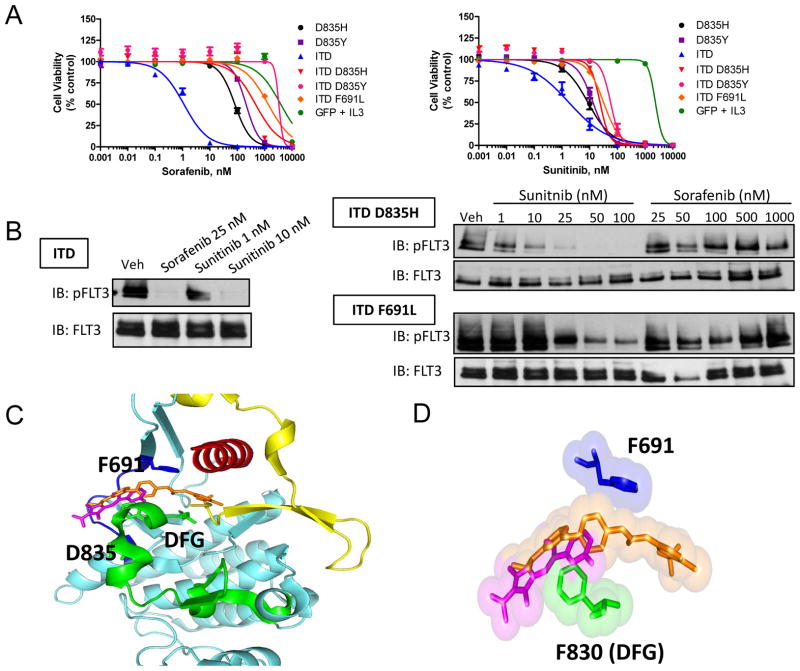
Figure 3.
Sorafenib-resistant FLT3 mutations are sensitive to sunitinib treatment.
A) BaF3 cells were treated with sorafenib (left) or sunitinib (right) for 72 hr and cell viability was measured. Data represent the mean +/− SEM of 2–4 independent experiments (n = 12–24 replicates). B) BaF3 cells were treated for 1 hr with sorafenib or sunitinib. FLT3 was then immunoprecipitated from cell lysate, and Western blot analysis was performed for phosphorylated and total FLT3 (IB, immunoblot). C) Structure model of sorafenib and sunitinib interaction with wild-type FLT3 (adapted from PDB IDs 1RJB, 3G0E, and 1UWH using Pymol software) (blue, hinge region; green, activation loop; red, αC helix; yellow, juxtamembrane domain; orange, sorafenib; magenta, sunitinib). D) Surface and stick representation of sorafenib, sunitinib, and residues F691 and F830 (DFG motif).

