
Figure 1.
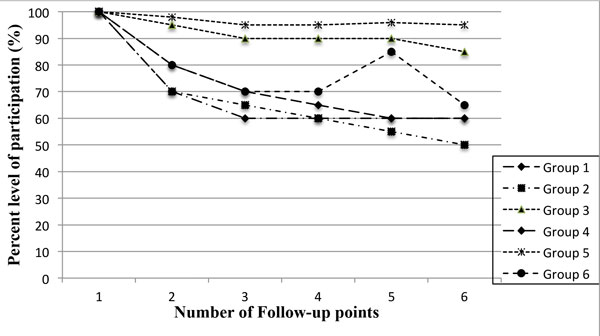
Showing the trends in levels of participation according to groups used in the analysis at different follow-up time points for the study sites summarized. The time points for each group may differ in year and type of study but the measurement was similar of the research subject willingness to participate.