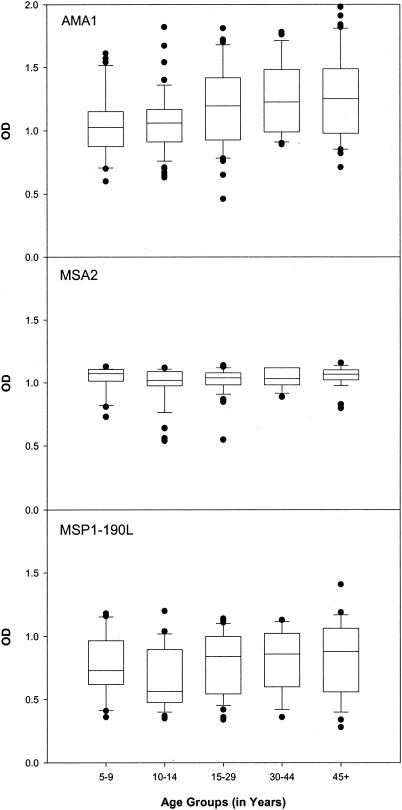
FIG. 1.
Relative levels of antibodies to AMA1, MSA2, and MSP1-190L, in each of five age groups (5 to 9, 10 to 14, 15 to 29, 30 to 44, and ≥45 years). Plasma samples from individuals residing in Etoa were tested by ELISA at a 1:200 dilution. Outlying values are shown as individual dots. Values above OD = 0.2 were considered antibody positive (i.e., greater than the mean + 2 SDs of the negative-control plasma sample). The OD values for each malarial antigen are displayed in box plots, with the median values represented by the horizontal line within each box. The boxed regions represent the interquartile ranges, while the upper and lower vertical bars represent the 90th and 10th percentiles, respectively.

