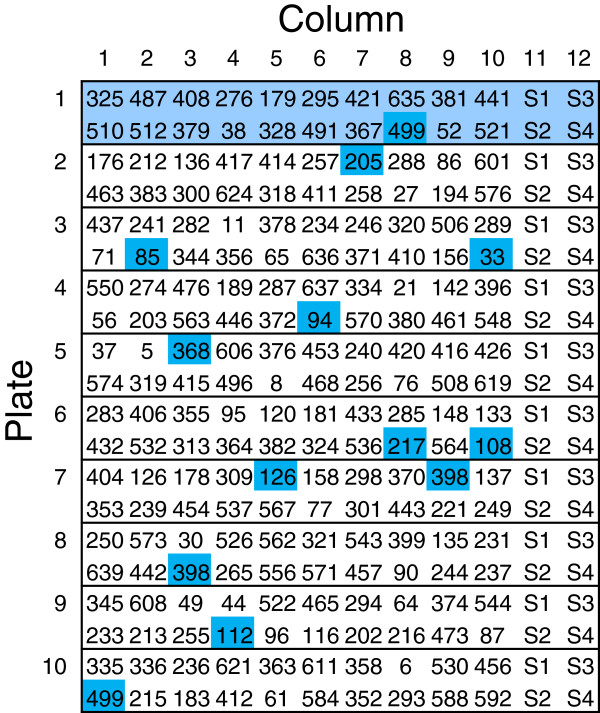
Figure 3.
Subset of the laboratory design of replicate block, showing the sample allocation and duplicated cultivars. The subset is the first ten plates of replicate block R1 (2010 trial). The cultivar numbers are shown; highlighted in dark blue are laboratory duplicated cultivars, and Plate 1 has been highlighted in light blue. Each cultivar number represents four replicate samples as illustrated in Figure 2. Columns 11 and 12 contain the same standard samples on each plate.

