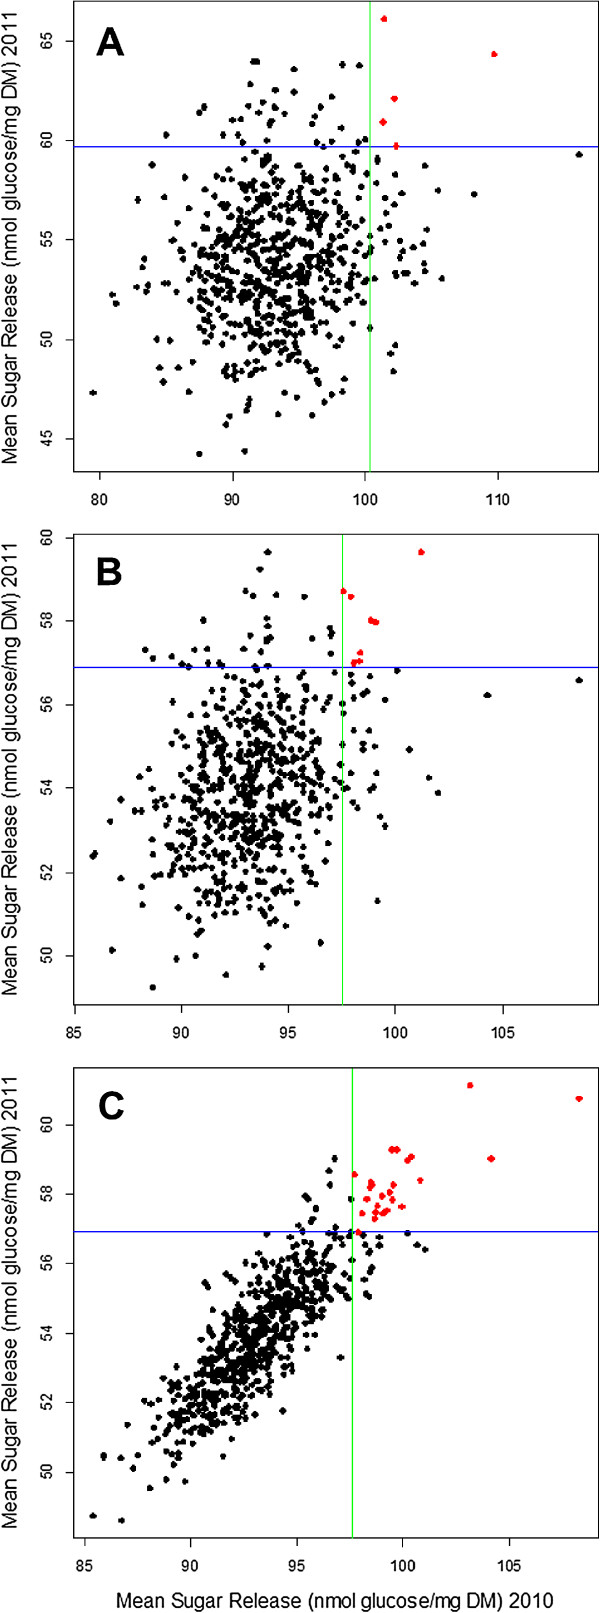
Figure 5.
Sugar release of each cultivar in 2010 and 2011 trials using models A, B and C. (A) The unadjusted mean sugar release (nmol glucose/mg DM) of each cultivar in each trial. (B) The cultivar mean sugar release after adjustment for field and laboratory variation, single trial analyses. (C) The cultivar mean sugar release after adjustment for field and laboratory variation, MET analysis. A, B, and C correspond to the output from models A, B, and C, respectively (Table 2). Cultivars to the right of the green line are the top 40 cultivars for sugar release in 2010. Cultivars above the blue line are the top 40 cultivars for sugar release in 2011. Cultivars highlighted in red are the cultivars that are consistently in the top 40 for sugar release in both years 2010 and 2011. There were five cultivars in the top 40 in both years for model A, eight cultivars for model B, and 25 cultivars for model C. DM, dry matter; MET, multi-environment trial.

