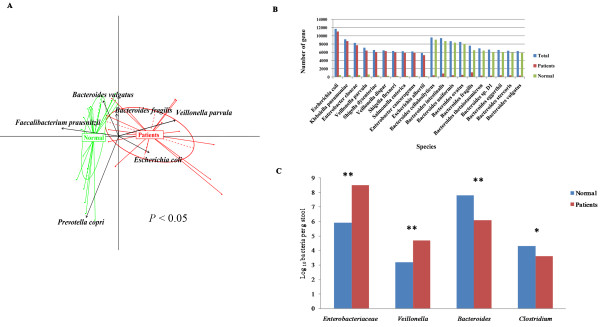
Figure 2.

Comparison of healthy and HBLC microbial structure. (A) Bacterial species abundance differentiates HBLC patients and healthy individuals. The first five principal components (P value in Tracy-Widom test < 0.05 and contribution > 3%) were examined: PC1 = 33.38%, PC2 = 21.81%, PC3 = 12.74%, PC4 = 10.31%, and PC5 = 6.17%. The first two components (PC1 and PC2) are plotted. (B) Species annotation of the significantly differential genes. Blue bars represent gene coverage of the significantly differential species, red bars represent gene coverage of the significantly differential species in the HBLC samples, and green bars represent gene coverage of the significantly differential species in the control samples. (C) Bacterial groups quantified using real-time qPCR. Blue bars represent the control samples, and red bars represent the HBLC samples. The Student t test was used to evaluate the statistical difference between the two groups. *P < 0.05; ** P < 0.01.
