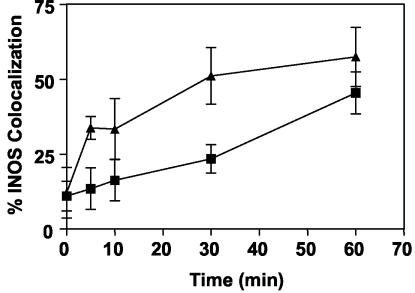
FIG. 3.
Quantitative analysis of iNOS colocalization with phagosomes. Colocalization of LB phagosomes and iNOS over time in IFN-γ- and LPS-stimulated J774 macrophages and in IFN-γ- and LPS-stimulated BMM from C57BL/6 mice. Each symbol represents the mean percent iNOS colocalization for at least four microscopic fields containing a total of at least 50 LB phagosomes. Squares, J774; triangles, BMM.

