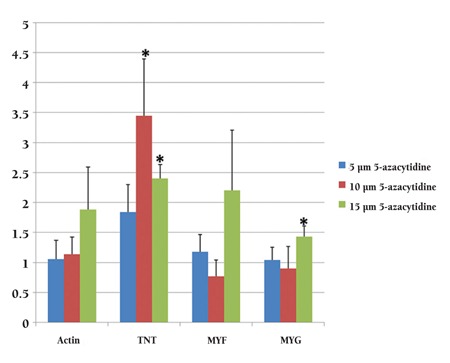
Figure 6. qRT-PCR demonstrated that compared with the expression levels of control cells, the expression level for myogenin was significantly higher in the cells that had been treated with 15 μM 5-azacytidine, and troponin T expression levels were significantly higher in the cells that had been treated with either 10 μM or 15 μM 5-azacytidine (p <0.05).

