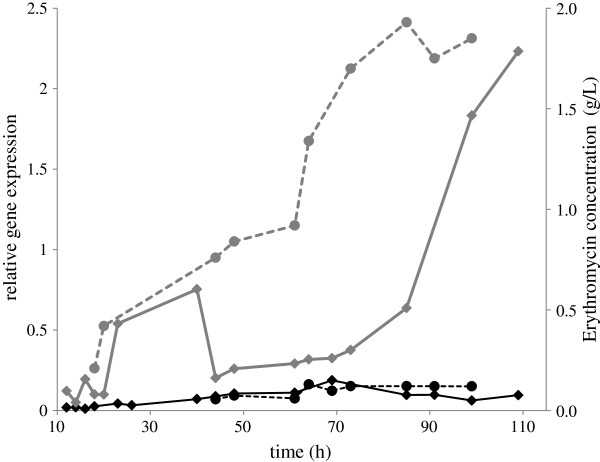
Figure 1.
Relative expression of SACE_5599 and erythromycin biosynthesis of the WT and industrial high-producing ABE1441 strains. Data from one representative fermentation process are shown, normalized to expression of 16S rRNA. Grey lines represent relative expression of SACE_5599 ( ) and erythromycin concentration (
 ) in the ABE1441 strain. Black lines represent relative expression of SACE_5599 (
 ) and erythromycin concentration (
 ) in the WT strain.

