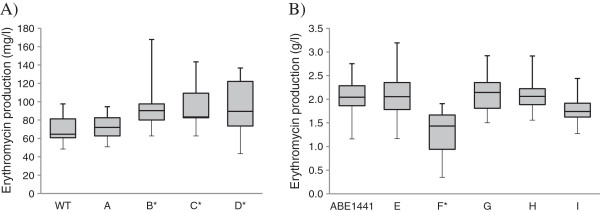
Figure 4.

Yield of erythromycin produced by different mutant strains of S. erythraea. Bars encompass 95% of the sample population. Horizontal lines represent the median values and perpendicular lines indicate extreme values (min, max). Asterisks denote statistically significant differences between experimental group samples compared to control samples. The data were analyzed using SAS/STAT program as described in Methods. Panel A): Erythromycin production by NRRL23338 transformants, determined by the microbiological assay; WT: control 1 NRRL23338; A: control 2 NRRL23338 + pSET152; B: NRRL23338 + SACE_5599-219 aa (pABE104); C: NRRL23338 + SACE_5599-219 aa-HA (pABE106); D: NRRL23338 + BldD (pABE21). Panel B): Erythromycin production by industrial high-producing strain ABE1441 transformants, determined by the HPLC-UV method; ABE1441: control 1 ABE1441; E: control 2 ABE1441 + pSET152; F: ABE1441 ΔSACE_5599 (pABE110); G: ABE1441 ΔSACE_5599 + SACE_5599-219 aa-HA (pABE112) sporulating strains; H: ABE1441 + SACE_5599-219 aa (pABE104); I: ABE1441 + BldD (pABE21).
