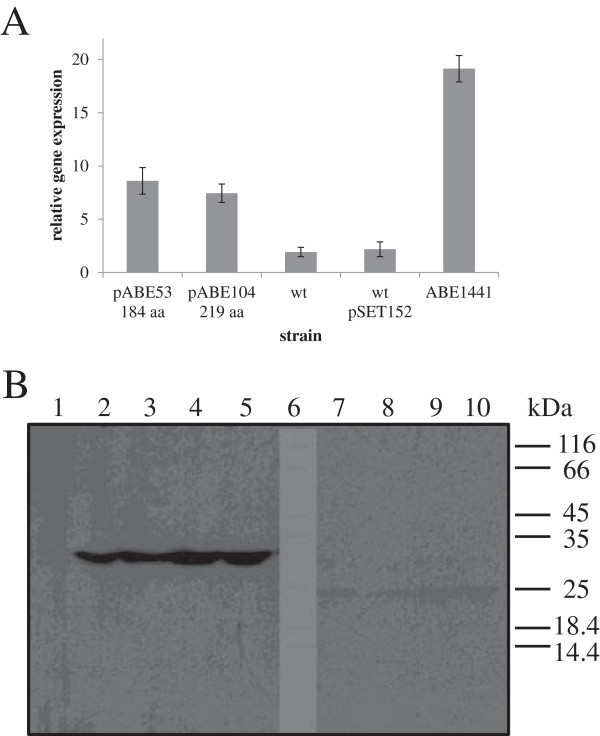
Figure 5.
Evaluation of in-trans expression of SACE_5599 in S.erythraea. A) qPCR analysis of expression levels of SACE_5599 (normalized to expression of 16S rRNA) in WT and strains with additional copy of SACE_5599 (pABE53, pABE104), compared to the ABE1441 high-producing strain. B) Western blot analysis of in trans expression of 219 aa (lanes 2–5) and 184 aa (lanes 7–10) SACE_5599-HA and the control NRRL23338 strain with pSET152 (lane 1). Molecular mass markers were loaded in lane 6 and their positions are schematically presented on the right side of the blot. Bands of apparent molecular mass of 33 kDa are observed in 4 independent 219 aa transformants of the NRRL23338 strain, two containing the RBS sequence (pABE107) in the expression vector (lanes 2–3) and two without the RBS sequence (pABE106) (lanes 4–5). A very weak band of apparent molecular mass of 25 kDa was observed when shorter variant (184 aa) of SACE_5599 was expressed, either without RBS (plasmid pABE102 – lanes 7 and 8) or with RBS (plasmid pABE103 – lanes 9 and 10).

