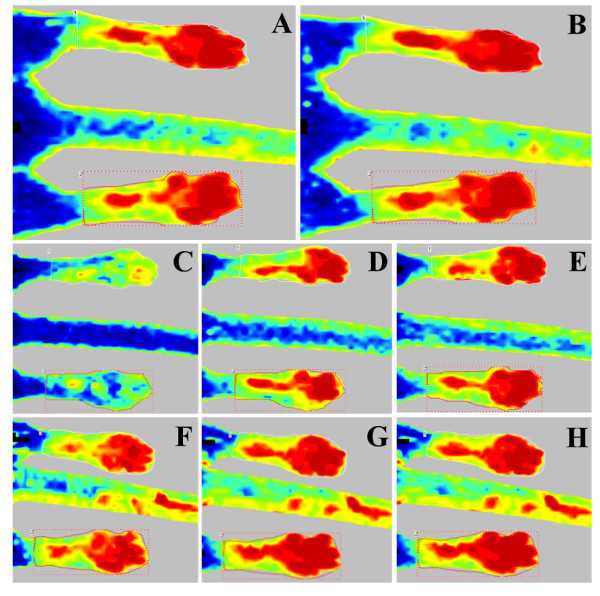
Figure 2.
Representative LDPI images. Peripheral perfusion patterns in mice over time after administration of 3 anesthetic protocols. Time points with significant differences (P < 0.05) are reported. Group 1 (top row) 10 (A) and 20 minutes after acepromazine injection (B); group 2 (middle row) 5 (C) and 15 minutes after dexmedetomidine injection (D) and 5 minutes after atipamezole administration (E); control group (lower row) 10 (F), 20 (G) and 30 minutes after isoflurane maintenance (H) (perfusion color scale 0–5 volts as reported in Figure 1).

