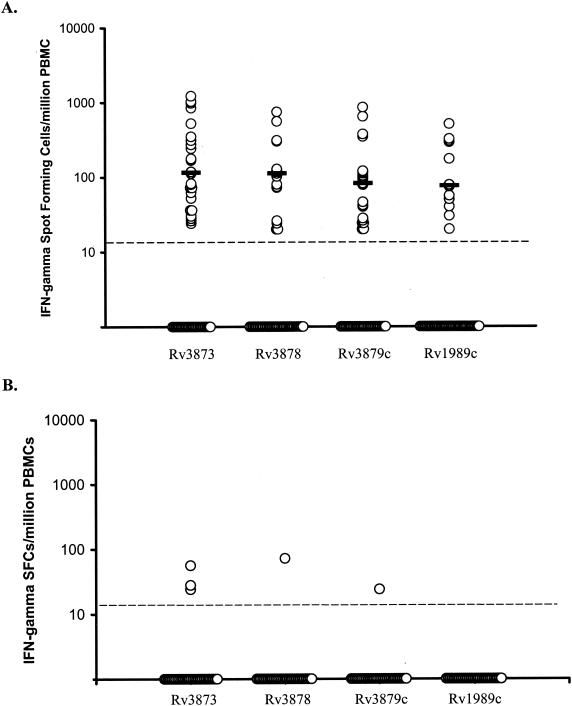
FIG. 2.
Magnitudes of IFN-γ ELISPOT assay responses to RD region antigens in 49 culture-confirmed TB patients (A) and 38 healthy, unexposed BCG vaccinees (B). Frequencies of peptide-specific IFN-γ-secreting SFC summated for each of the constituent peptide pools for each antigen, enumerated by ex vivo ELISPOT assay in patients with TB (A) and healthy, unexposed, BCG-vaccinated donors (B), are shown. Each horizontal bar represents the median response for each antigen. Points on the baseline represent individuals with no response to a given antigen (i.e., fewer than five SFC above the negative control for each of the constituent peptides of each pool of the given antigen). The broken horizontal line represents the predefined cutoff point (five SFC per 2.5 × 10⁵ PBMC, which translates into a threshold of detection of 20 peptide-specific T cells per 106 PBMC).

