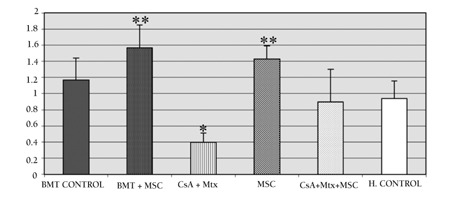
Figure 6. The ratio of CD4/CD8 expression in the studyand control groups. The ratio of CD4/CD8 expressionwas significantly increased in the MSC groups, but ratherdecreased in the CsA+MTX group in comparison with thehealthy control. * p=0.008 in comparison with CG-III (healthy control). ** p=0.014 in comparison with CG-III (healthy control).

